Grafana Integration (Web Client)
This guide shows a simple example of how to create your first dashboard using UR Cloud API and Grafana Web Dashboard. In this tutorial, you will learn to retrieve the joint temperatures, the variables of the running program, and the connection of the robot itself.
Estimated time to complete: 20min - Given all prerequisites have been done
Prerequisites
You need an active account at Grafana. They offer a free trial which is more than sufficient for most businesses. You can read more about it here as well by signing up. This tutorial was made using the free trial.
Words highlighted in bold are buttons. Words in italic are selections from dropdowns.
Step 1
Before starting this step, make sure you have a Grafana account and are logged in.
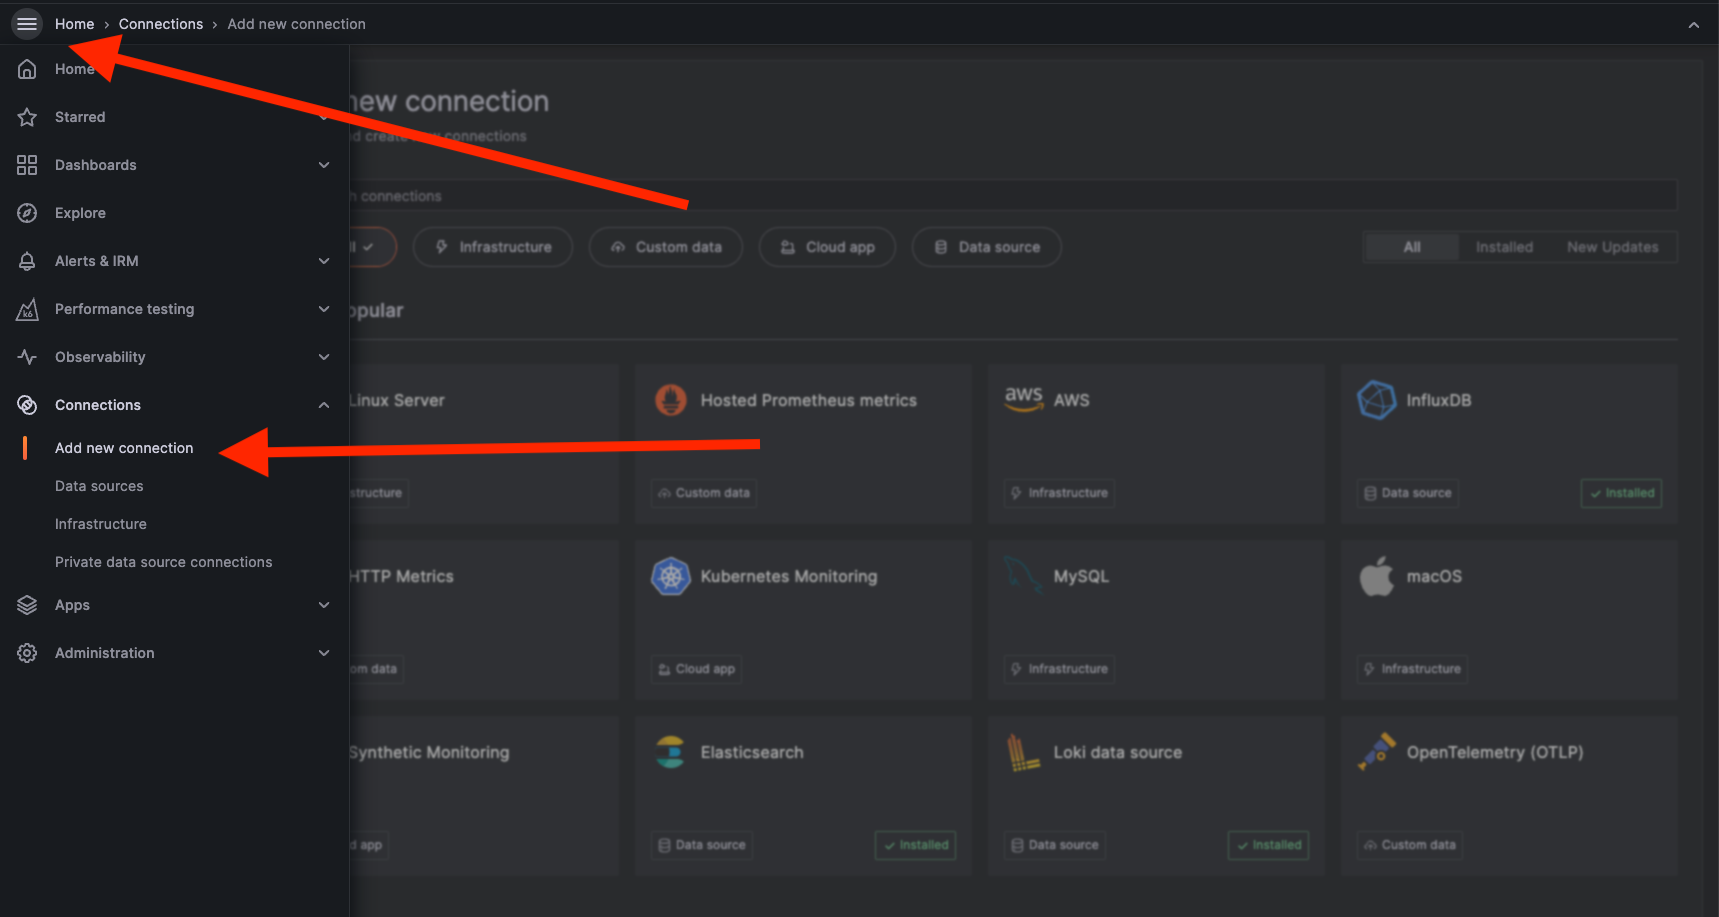
Click the Hamburger menu and select Connection. From the submenu, choose "Add New Connection."
If you already have a Grafana account, and have the JSON API plugin installed, you can jump to Step 4
Step 2
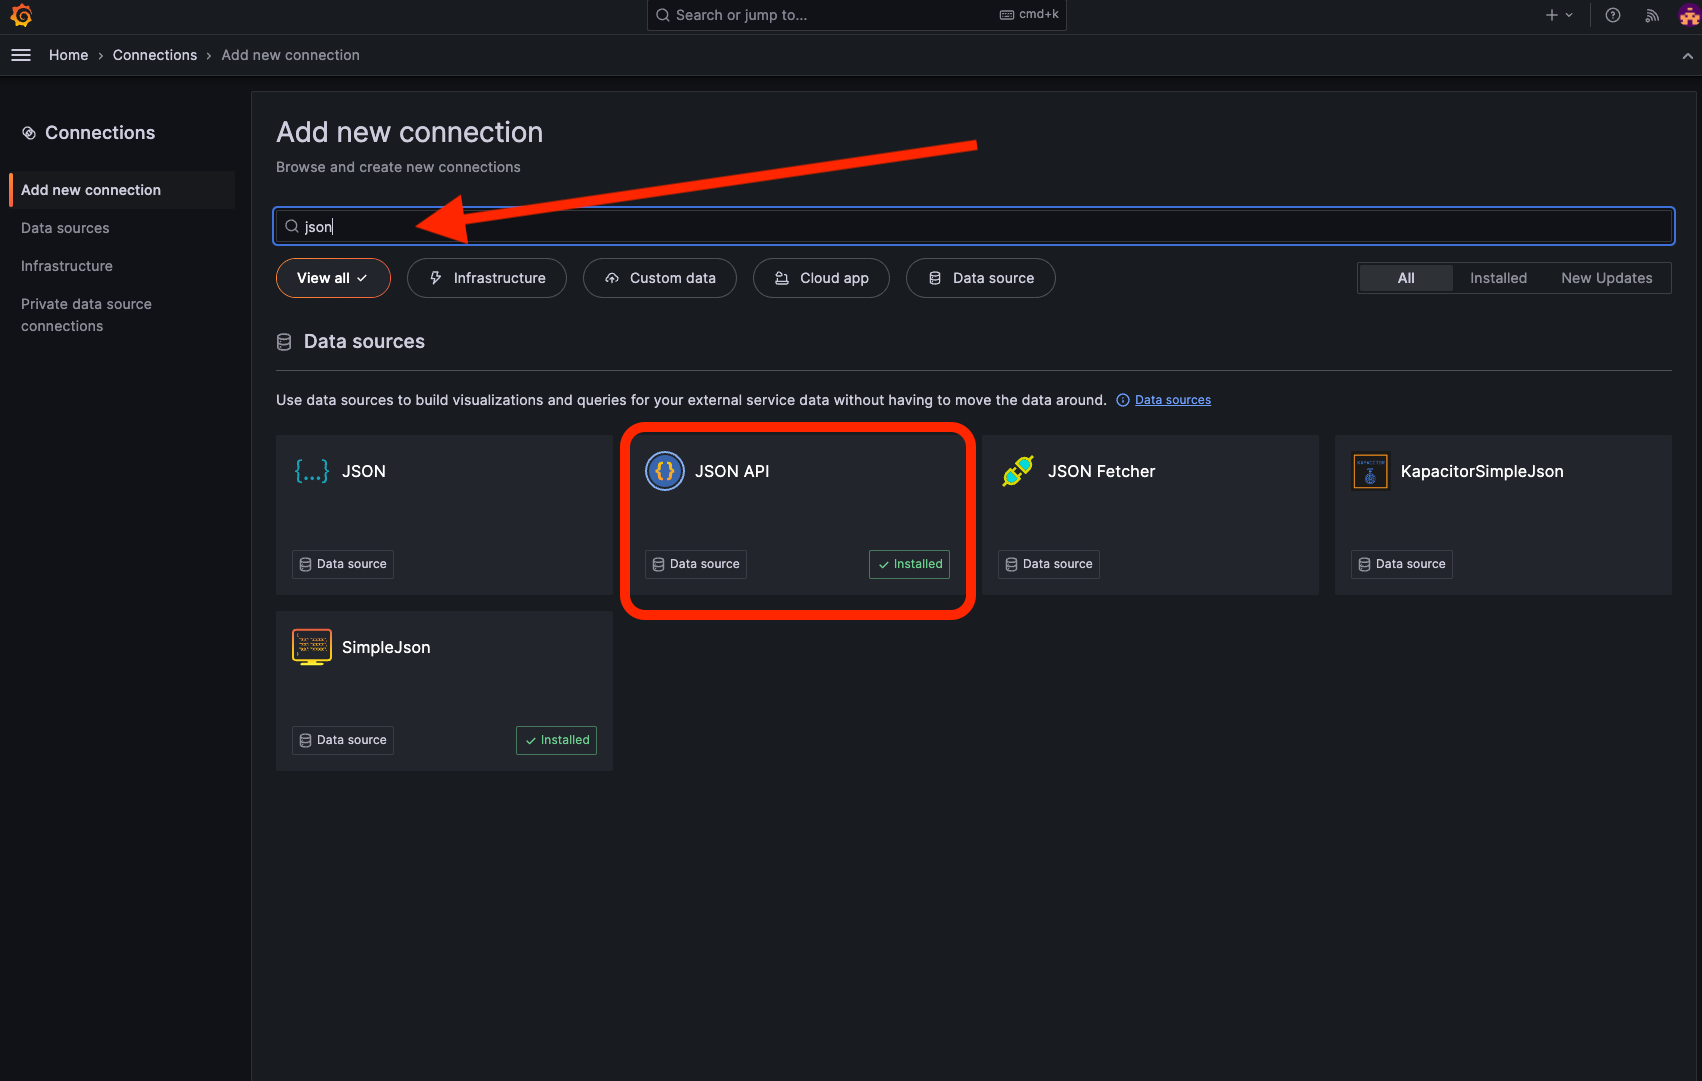
Click the search bar and search for the plugin named "JSON API." Once found, click on the JSON API tile.
Step 3
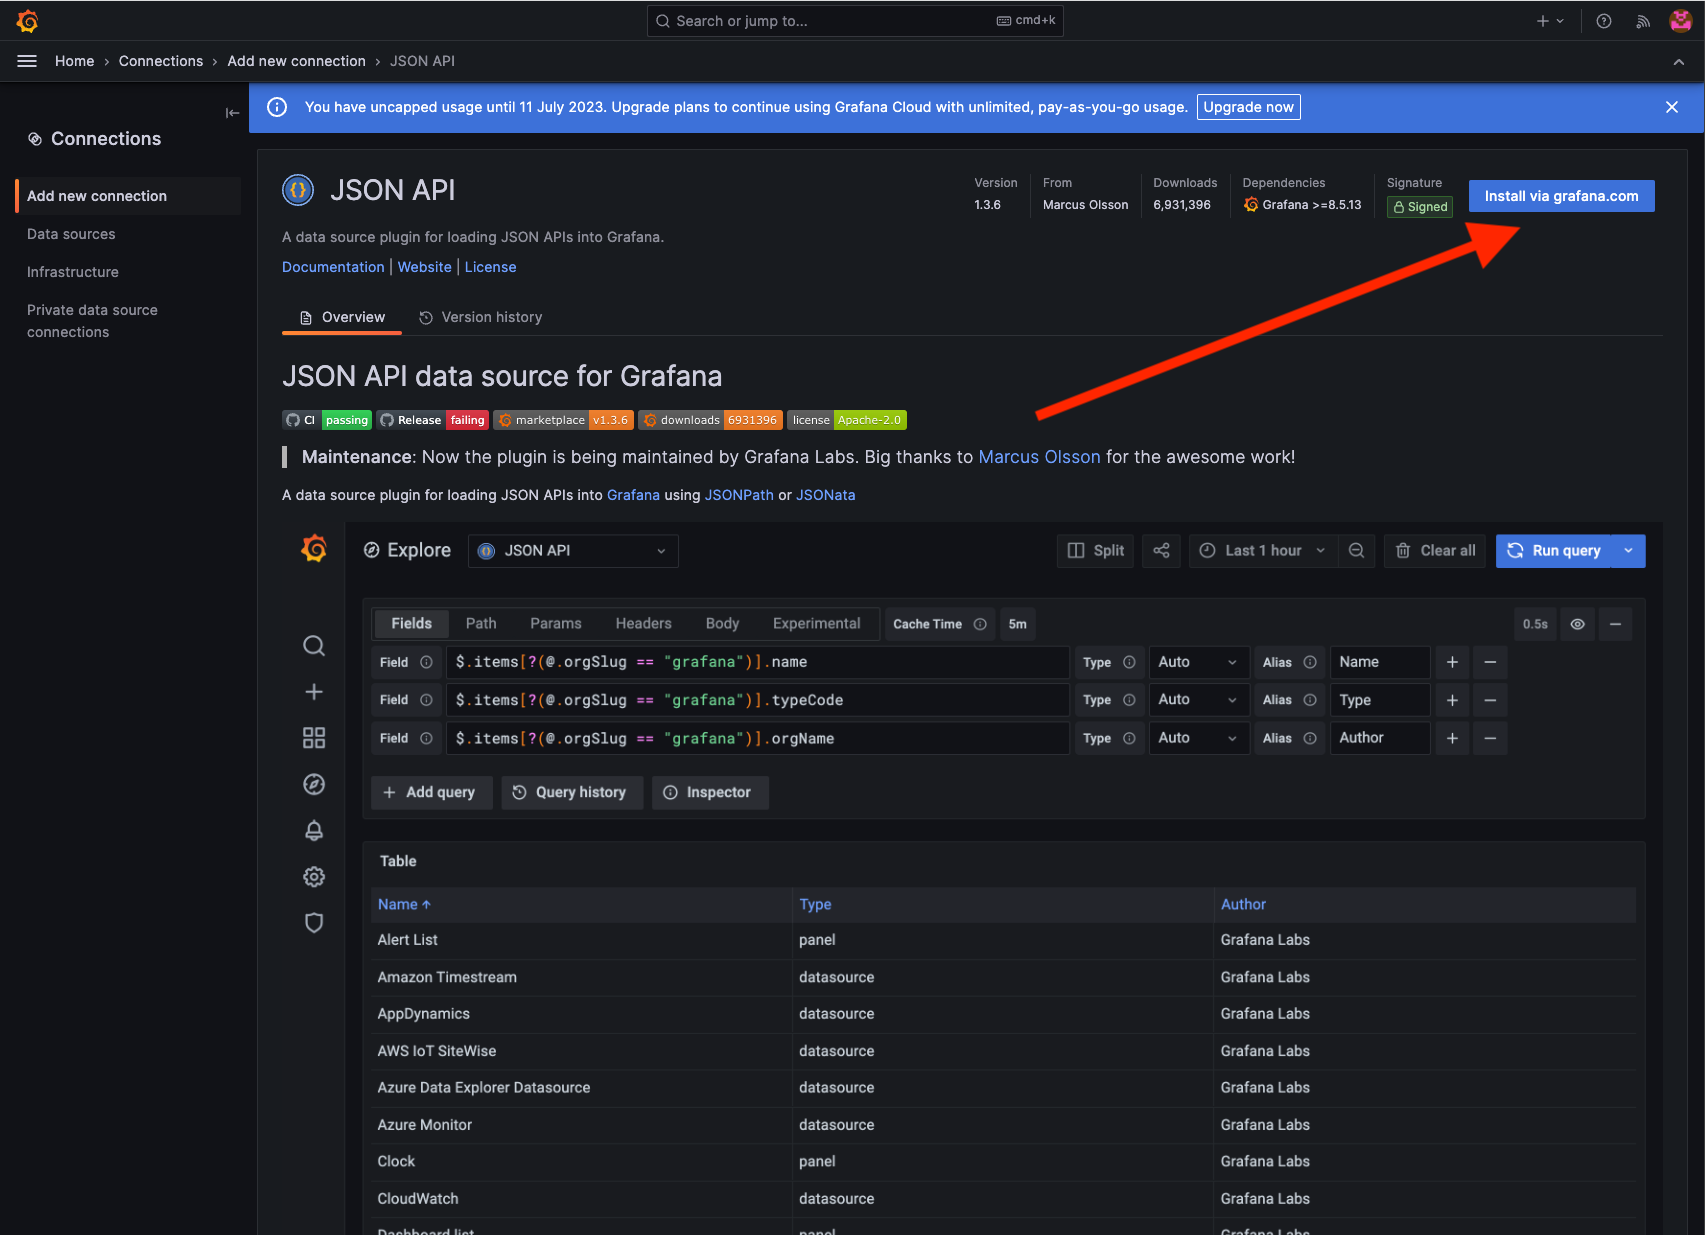
To install the plugin to your Grafana account, click the "Install via grafana.com" button in the upper right corner.
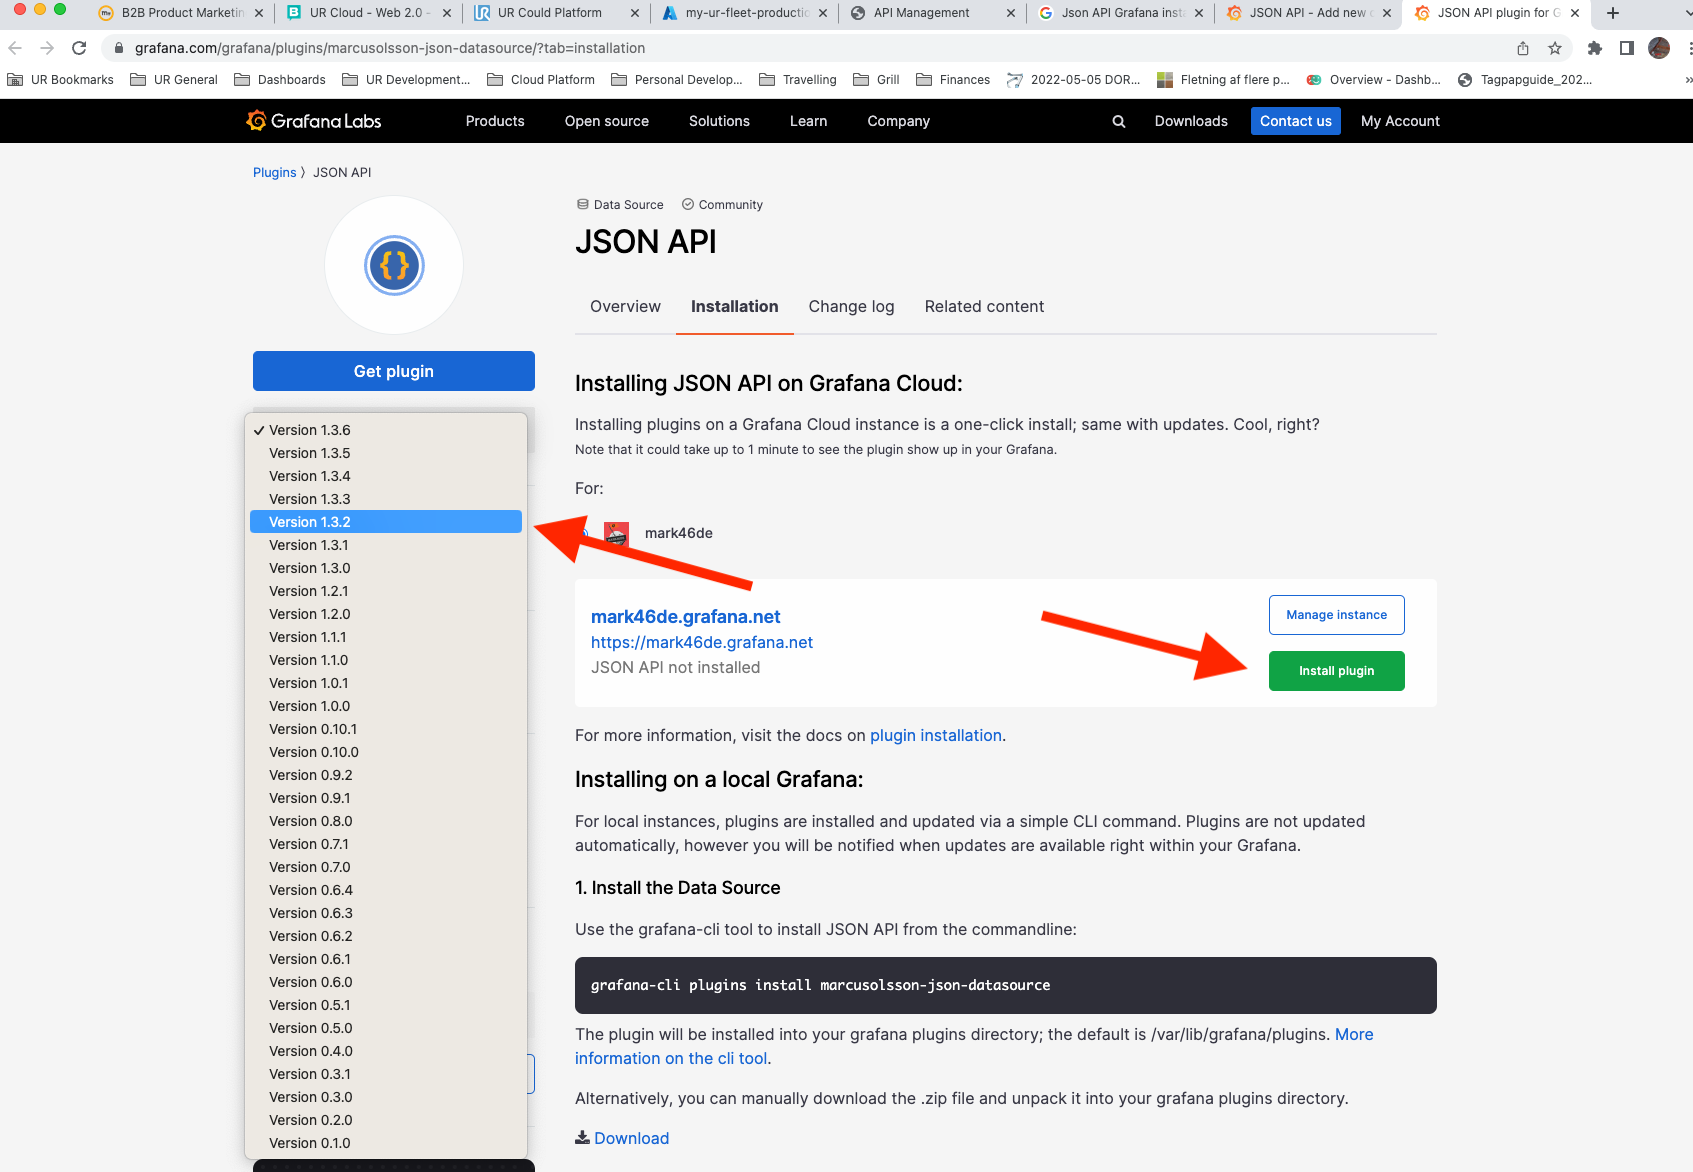
Make sure you choose version 1.3.2 by clicking the versioning number right beneath the Get Plugin button. There are some bugs in the higher versions making JSON Queries inaccessible.
Click the Install Plugin button to install the plugin. You can now close this window and return to your Grafana Cloud. The Grafana Cloud tab should still be open, as the page you just visited was opened through a new tab.
It usually takes 1-5 minutes before the plugin is installed.
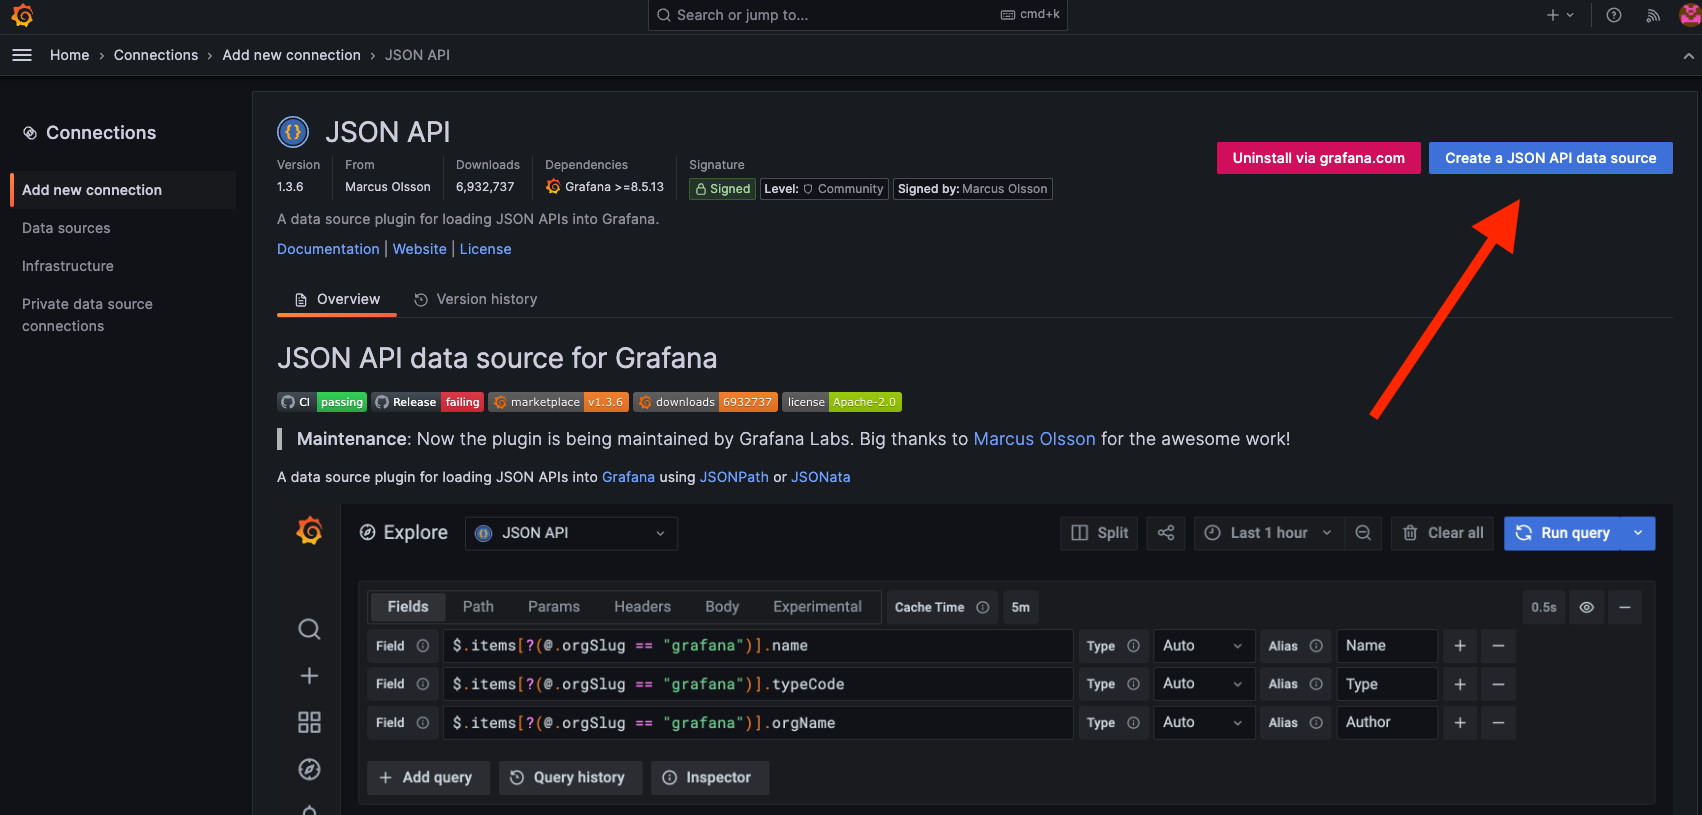
Step 4
Once the plugin is installed (you can refresh the page until you see the new action. bars in the upper right corner), click on the Create a JSON API data source button.
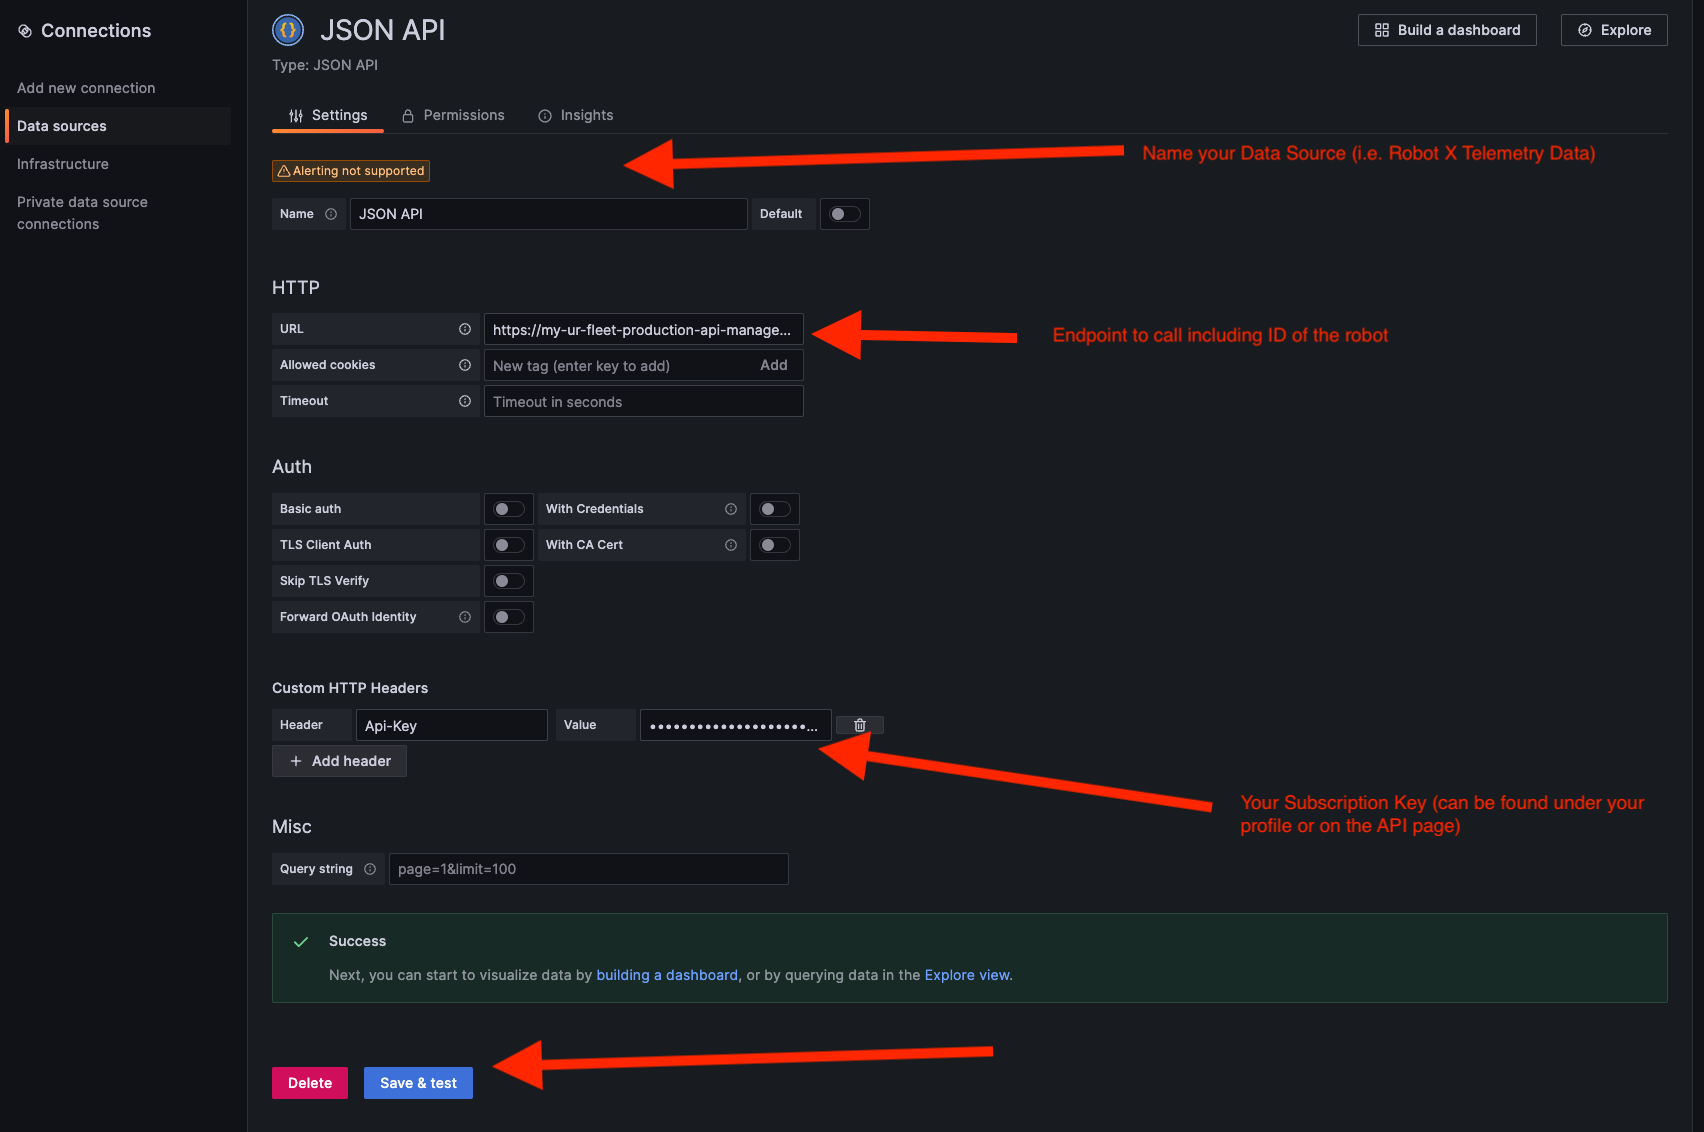
Step 5
1) Provide a name for the connection. You will need a data source for each robot and endpoint you're calling, so you could i.e., include the name of the specific robot and what data you are extracting.
2) Input the endpoint URL. Remember to include the full URL with the ID of the specific robot. In this tutorial, we have added the following URL:
https://my-ur-fleet-production-api-management.azure-api.net/v3.2/openapi/robots/get-latest-log/{id}
3) Add the Api-Key header to the call. The value is your subscription ID you can find under your profile (the Primary or Secondary key)
4) Save and test the data source
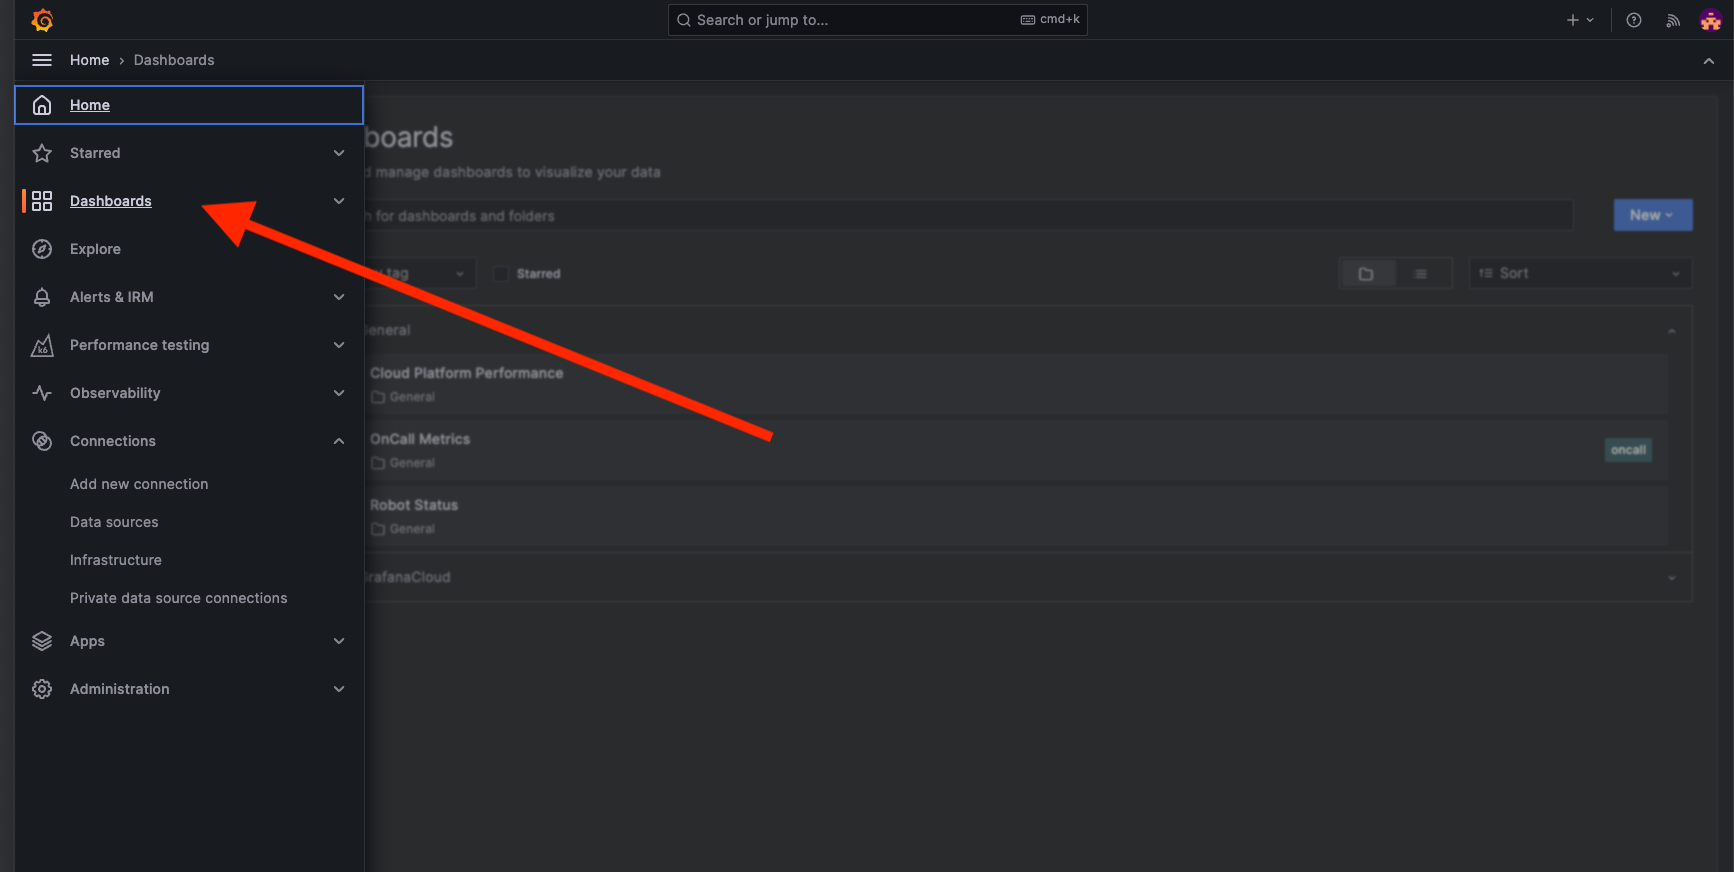
Step 6
Now that you have added the data source, you can now create a dashboard and visualize it.
Click on the hamburger menu in the upper left corner and choose "Dashboards".
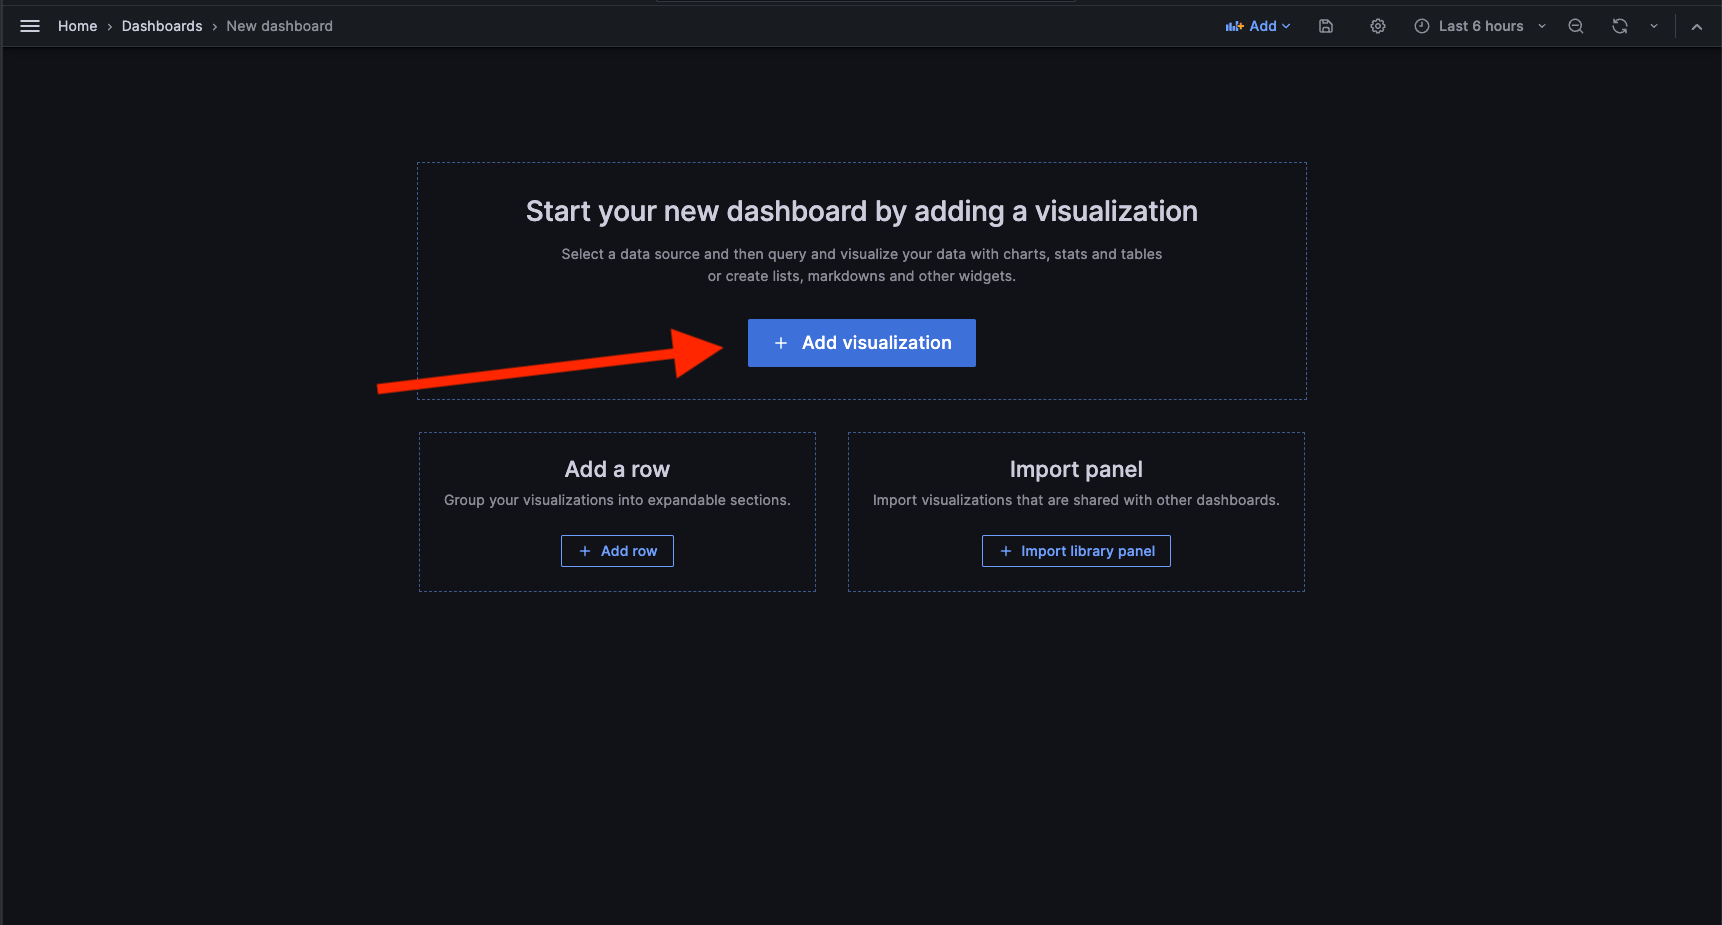
Step 7
Click the Add Visualization button
Step 8
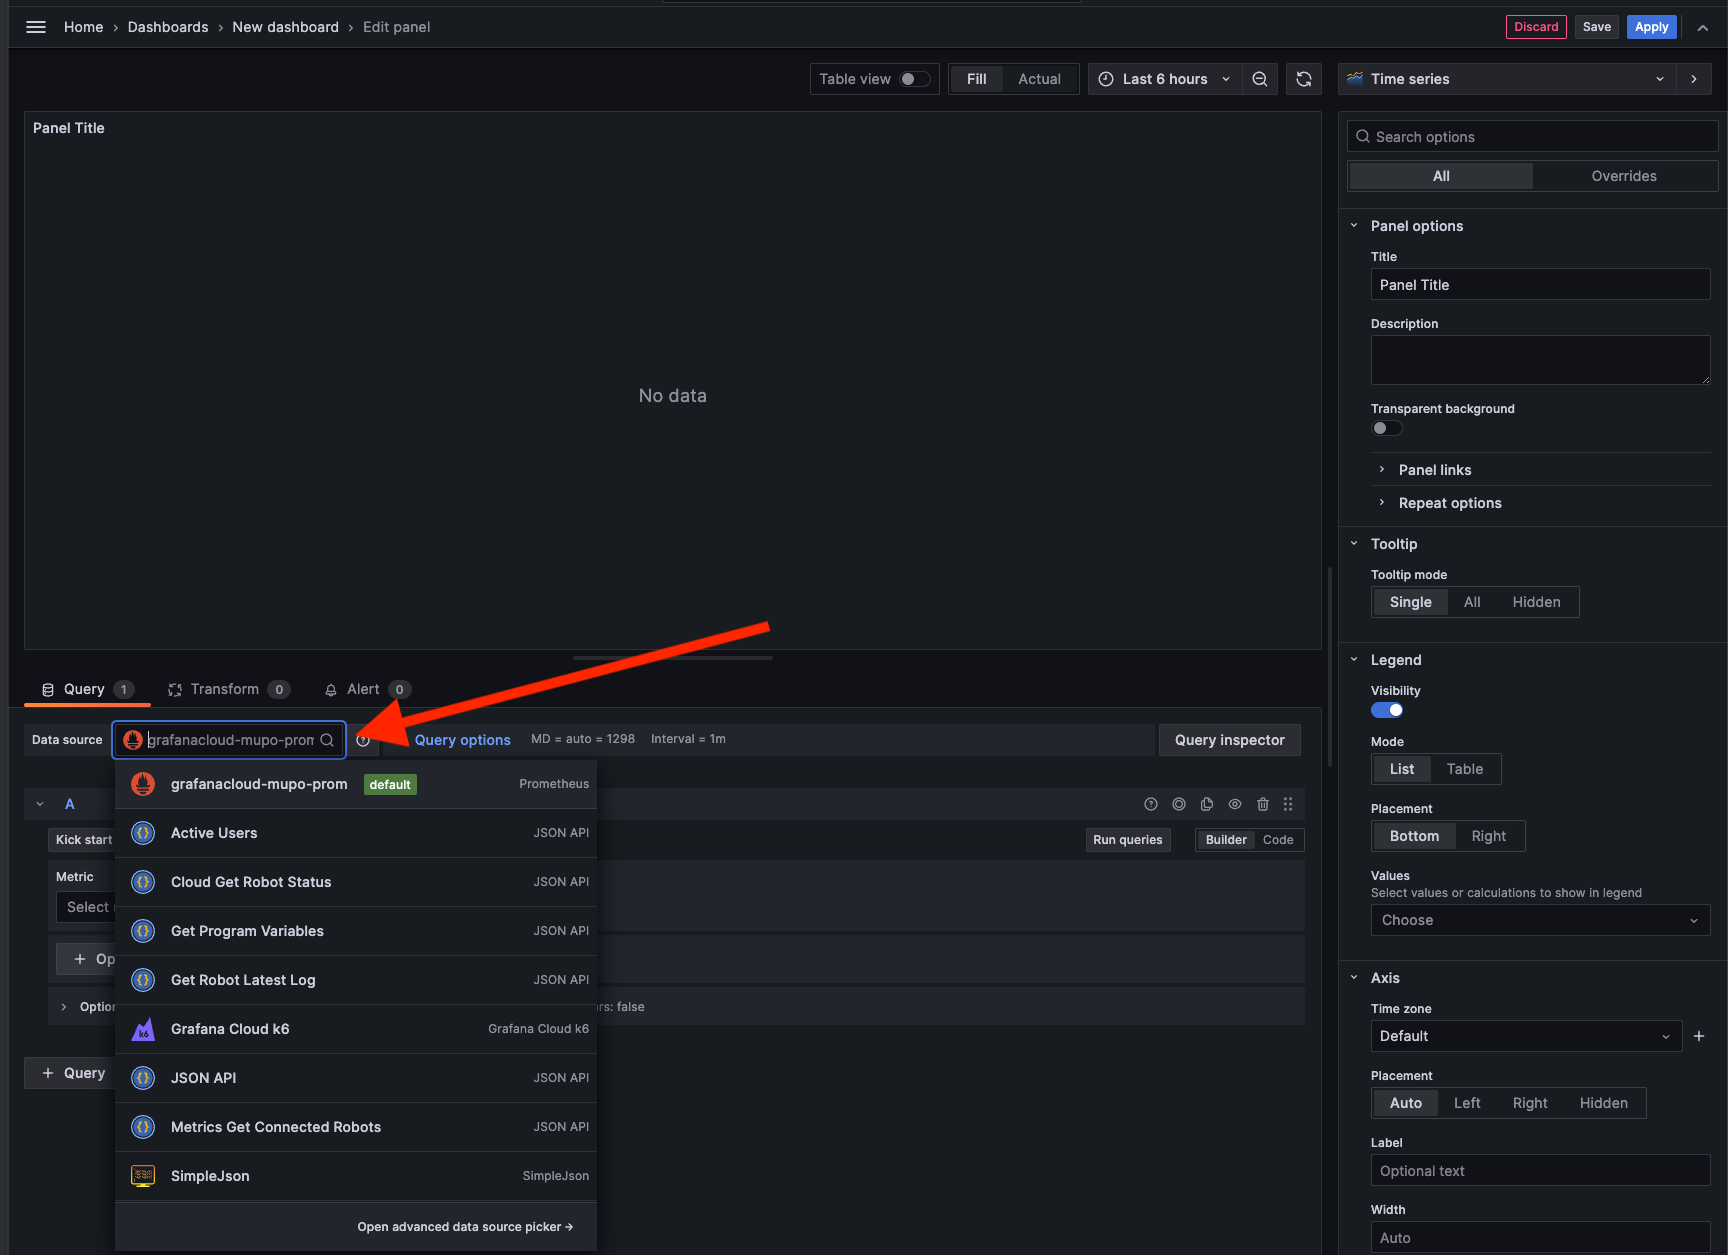
The next step is to choose from which data source you would like to show data. Find the data source you added in Step 5
Step 9
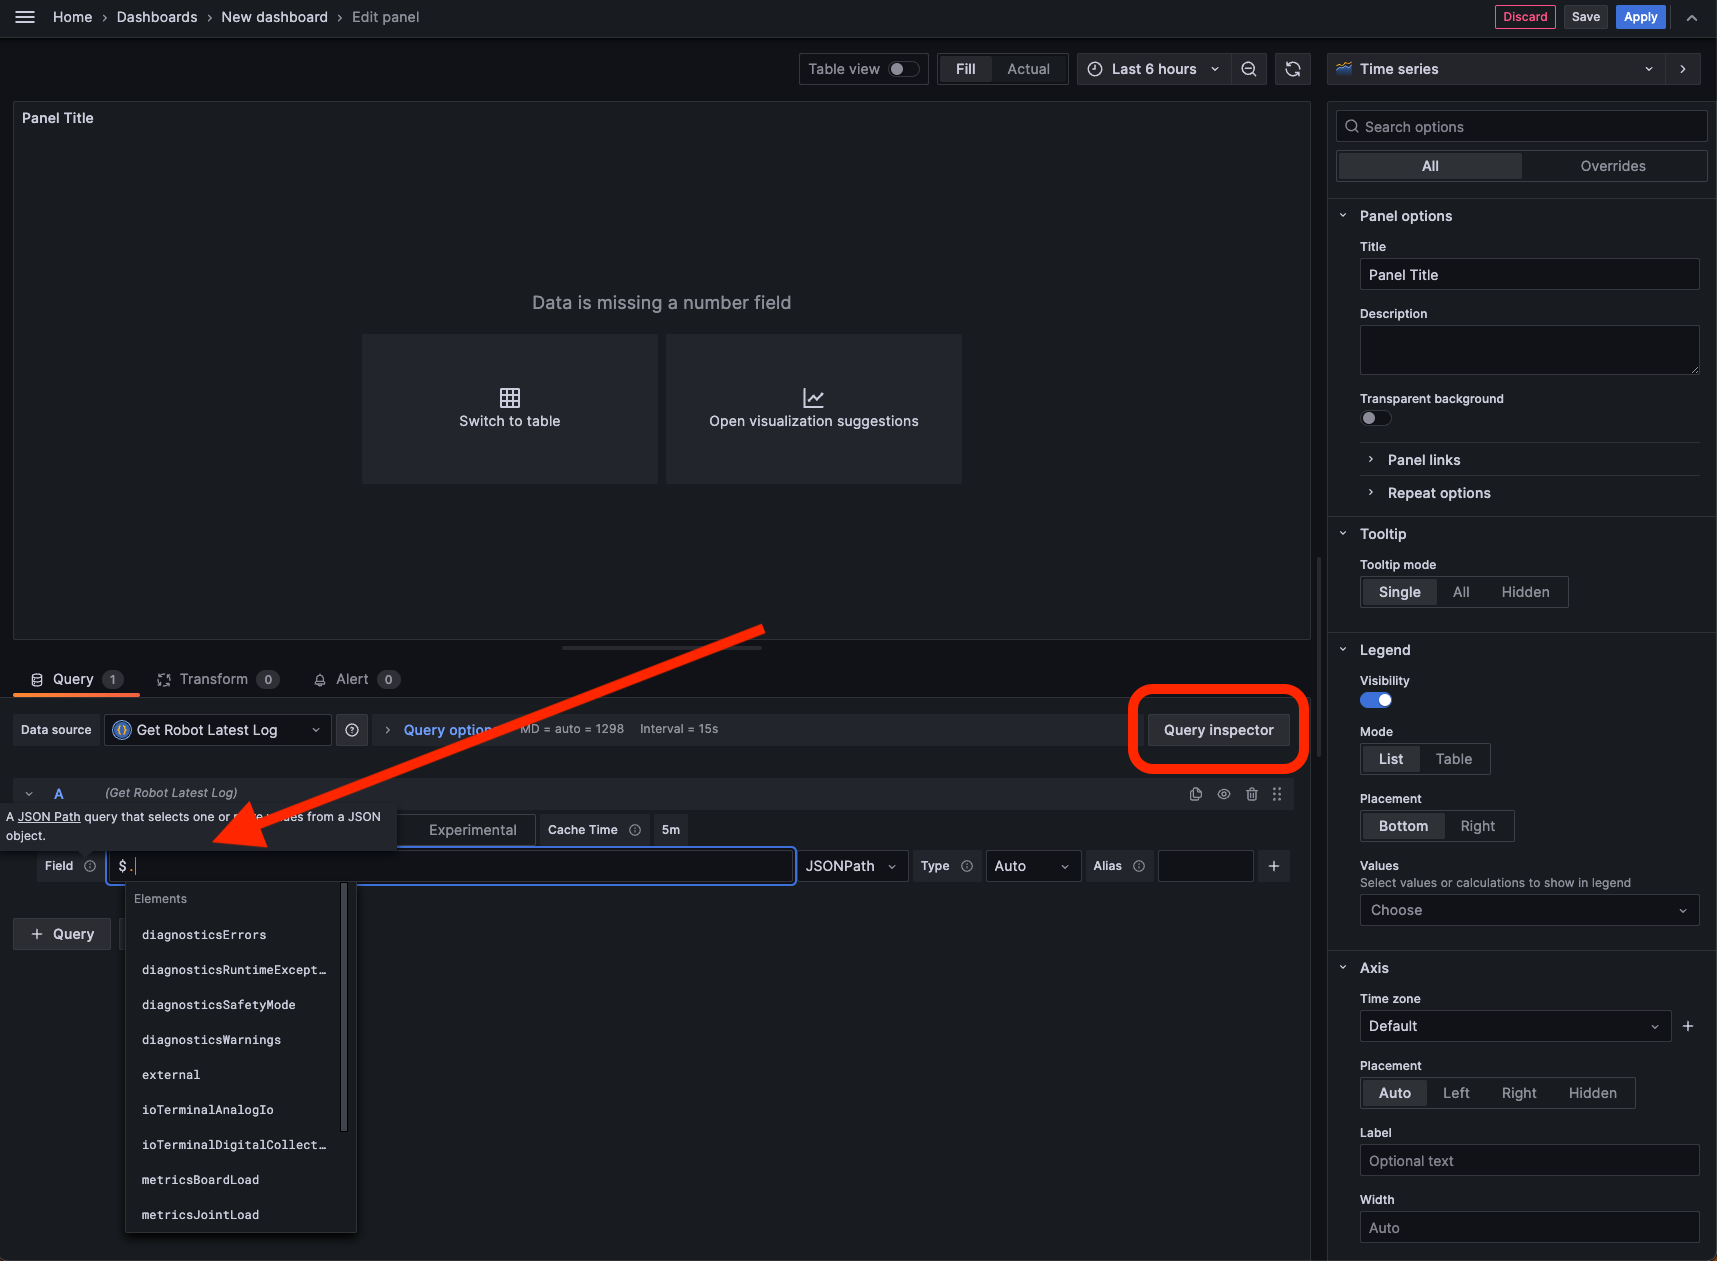
Once the data source has been selected, you can now choose what data you wish to show from the JSON input.
If the Field box is not visible, you can click on the Query Inspector button (see red square). In the side panel that appears under the Query tab, click Refresh. Wait a few seconds and close the sidebar. The Field box should now be visible.
By typing "$." you should get a list of available data sources from the JSON input. In this tutorial, we will show the temperature of the base joint. It should imitate the following JSON format returned from the endpoint:
"metricsJointLoad": { "motors": [25.5, 25, 24.5, 24, 23.5, 23] },
The final string will look like this:
$.metricsJountLoad.motors[0]

Step 10
The data is now set up, so the last step is to visualize it. In this tutorial, we'll show it as a base number using the Stat visualization.
From the visualization dropdown in the upper right corner, choose Stat. The data should now be shown as a number once selected.
Click the Apply button in the upper right corner to save your new visualization tile..
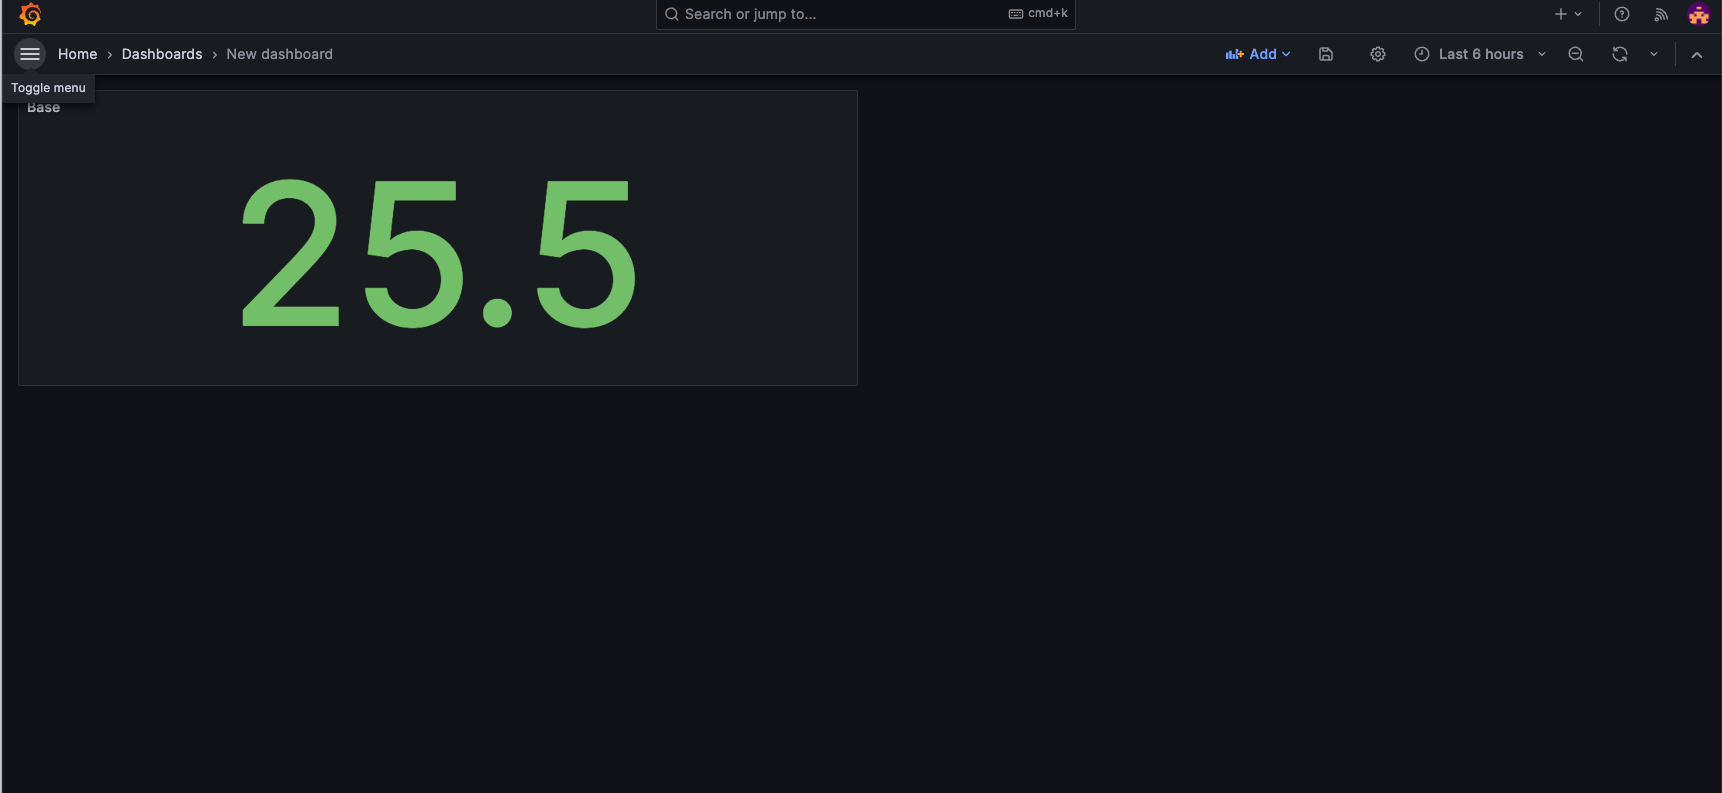
Step 11
Once added to your dashboard, you should now see a tile similar to the picture on the right. You can drag the corners to adjust the size as well moving it around.
Step 12
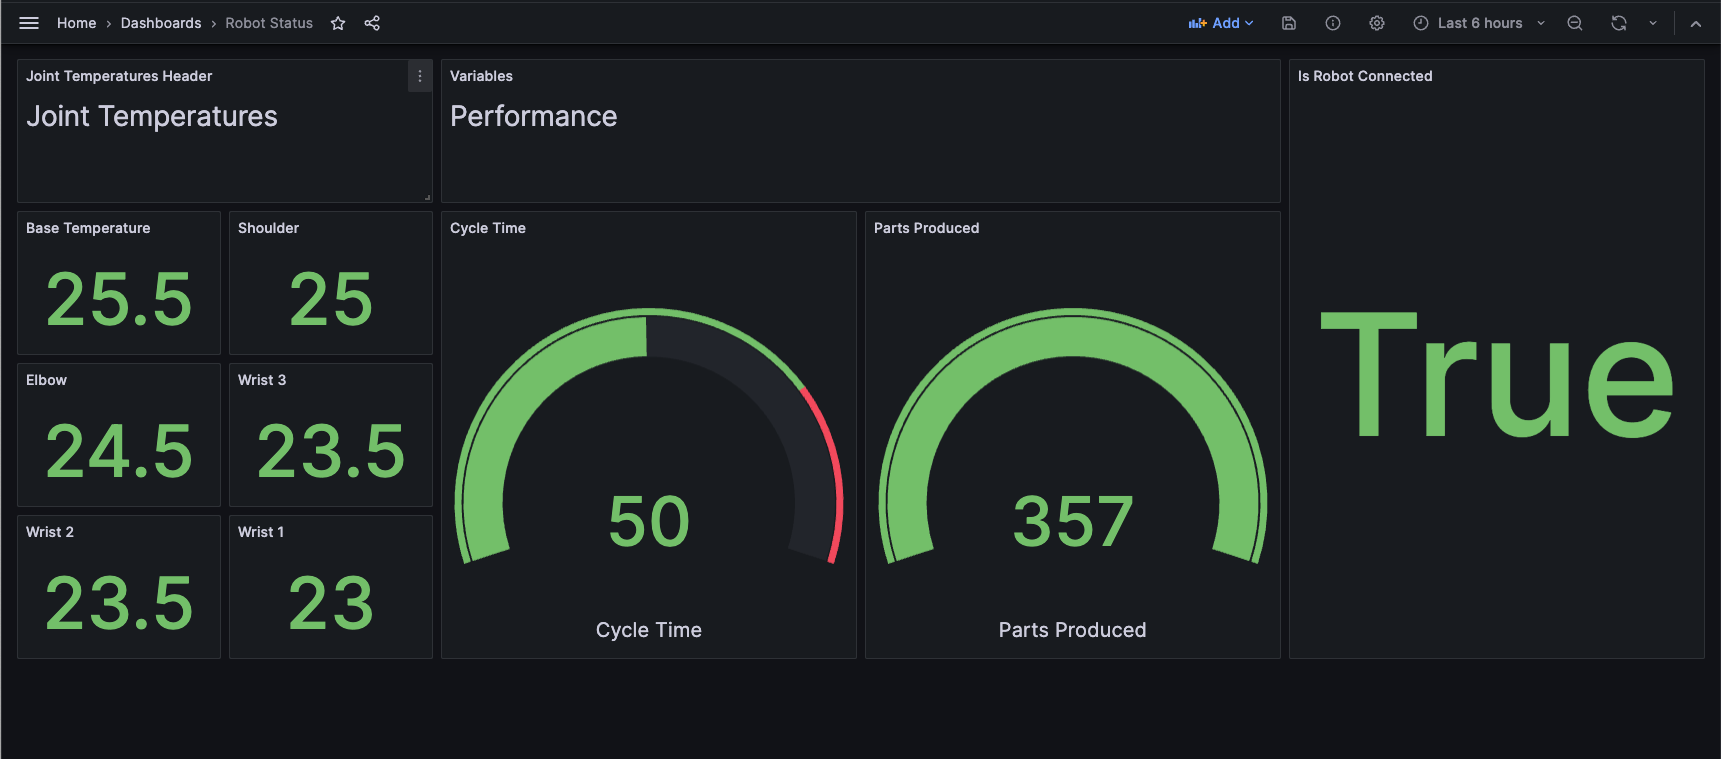
You can now redo Steps 8 through Step 11 to add the remaining joint temperatures.
You can also add other endpoints using Step 4 and Step 5 and visualize them. The picture on the right makes use of the following endpoints to visualize the variables of the running program as well as the join temperatures:
Temperatures: https://my-ur-fleet-production-api-management.azure-api.net/v3.2/openapi/robots/get-latest-log/{id}
Variables: https://my-ur-fleet-production-api-management.azure-api.net/v3.2/openapi/robots/get-program-variables/{robotId}